What is Overfitting?
How we avoid overfitting in trading strategy development. Overfitting happens when a strategy looks "perfect" on past data but fails in real markets because it learned noise and coincidences that won't repeat.
Overfitting happens when a trading strategy is tailored too closely to historical patterns, including randomness, so it performs in backtests but fails forward.
It leads to false confidence. Results that look strong in backtests break down live because the strategy doesn’t generalize. It was built to win in the past, not in the future.
- Too many filters: adding rules until the backtest looks perfect.
- Small sample sizes: drawing conclusions from a handful of trades.
- Curve fitting: tweaking parameters until history looks good without real-world logic.
Why WSV Strategies Are Not Overfit
1. Massive Dataset
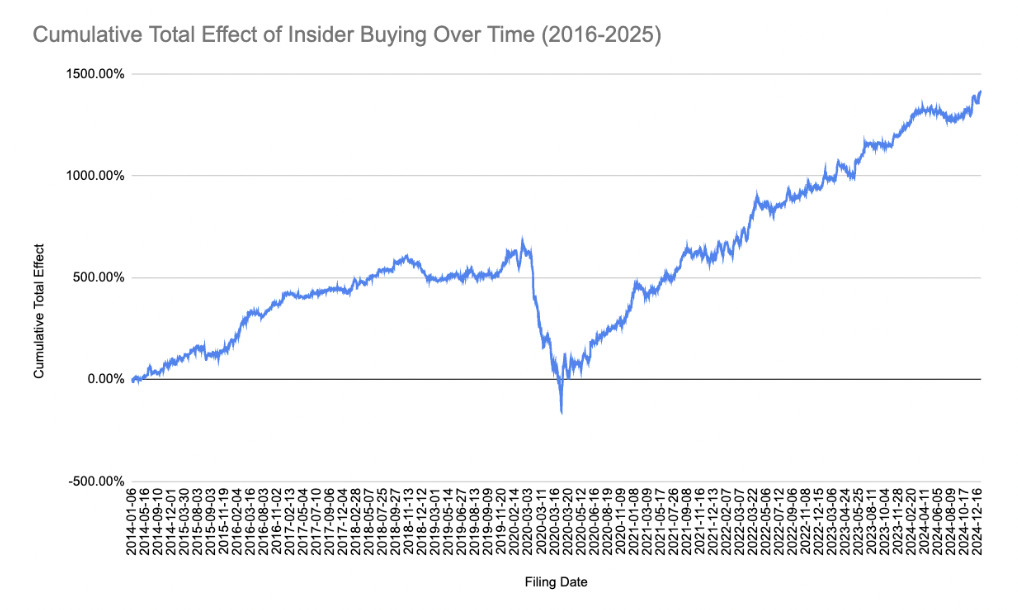
Since January 1st, 2020, there have been over 30,000 insider buys. Before any filters, we measure the total effect by tracking open-to-close performance after filings become public—our baseline truth.
The data shows a clear, consistent effect: insider buying moves markets. This isn’t an opinion—it’s measurable across tens of thousands of cases.

Baseline effect: open→close reaction after insider filings become public.
2. First Principles Foundation
Every filter is grounded in first‑principles logic and then validated statistically. Insiders know their companies; when they buy, it’s a tangible signal that reliably creates demand.
Human psychology around insider buys doesn’t change. That permanence—not curve fitting—drives our design.
3. Filtering with Logic and Evidence
The insider effect varies with conditions. Rather than try to time the “on/off” periods, we use robust filters to capture the strongest signals and reduce risk when the effect is muted.
Example – ATR filter: By excluding stocks with daily ATR below 8%, we remove over half of buys while sacrificing none of the profits. Low‑volatility names rarely react to news; higher‑ATR names do.
4. Avoiding Small Sample Pitfalls
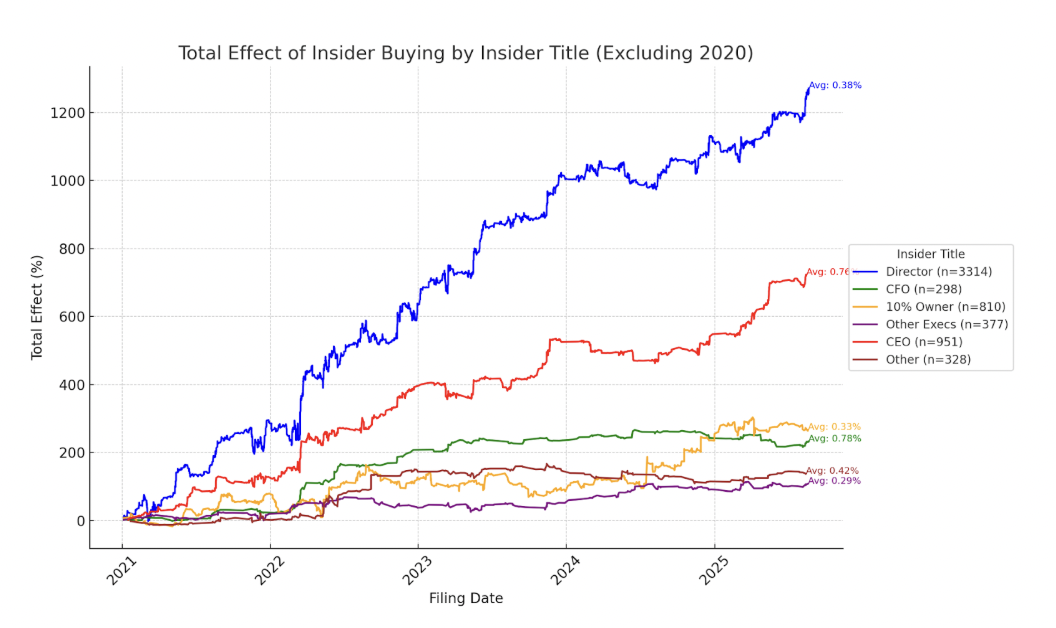
CEO buys show a slightly stronger effect (~0.76% vs ~0.38%), but the CEO sample is small (~950 vs ~3,300 director buys) and not statistically significant. We avoid cherry‑picking and focus on broad, repeatable patterns.

Small samples mislead: favor broad, repeatable patterns over rare subgroups.
5. Control Group Testing
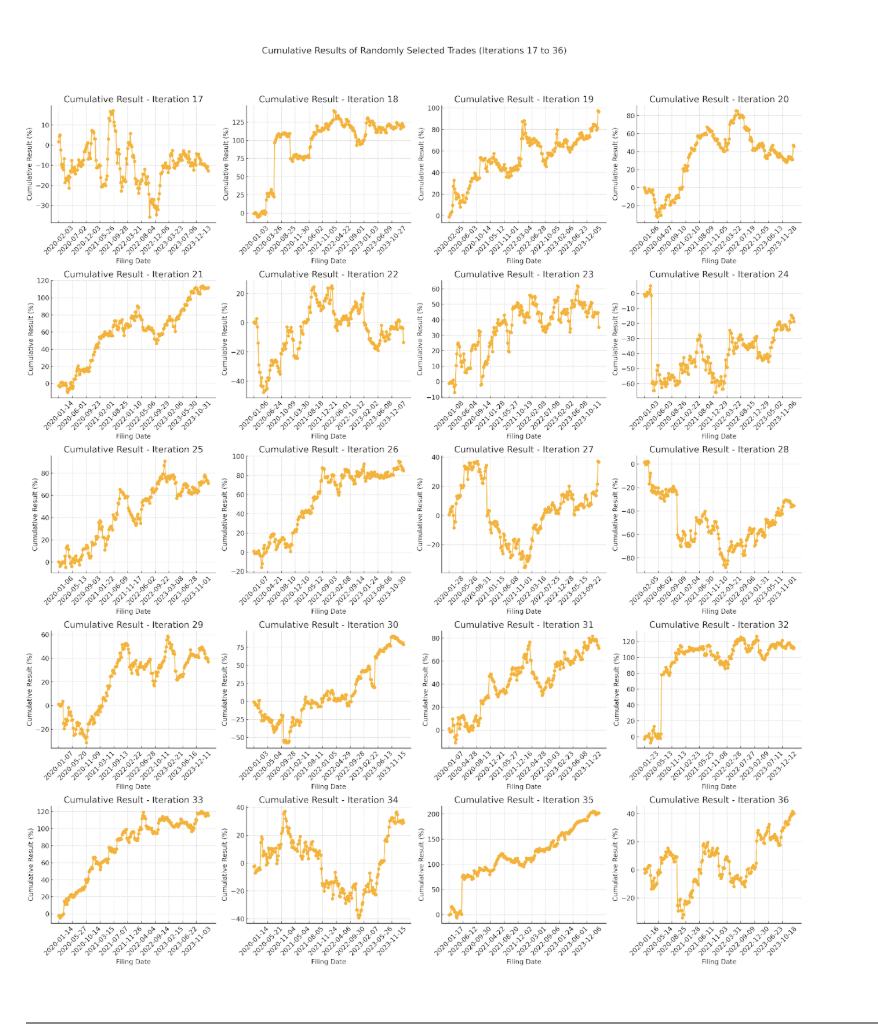
We compared our conservative strategy (~100 trades since 2020) against 100 random control groups of 100 trades each, sampled from a conservatively filtered pool (~6,000 tradable insider buys).
- Control groups averaged ~65% total (~16% per year).
- WSV’s conservative strategy achieved nearly 300% in the same period.
That’s nearly 5× the return of random selection, demonstrating real edge—not luck. The random baseline’s strong returns also highlight how powerful insider buying is overall.

WSV vs. random selection: real, repeatable edge—not noise.
Bottom line: WSV strategies are built on massive, repeatable datasets; grounded in first principles; supported by statistically sound filters; and validated against control groups.
Conclusion
Overfitting is the silent killer of most strategies. We avoid it by grounding decisions in permanent market truths—insider knowledge, human psychology, market mechanics—and validating them across tens of thousands of trades.
In short: our edge is real, repeatable, and robust.